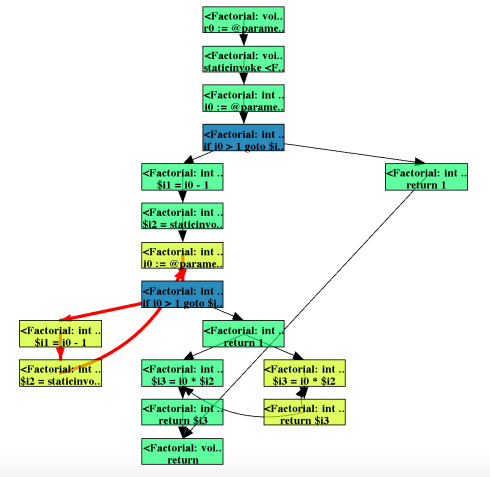
J-Viz: Finding algorithmic complexity attacks via graph visualization of Java bytecode
Аннотация:
Аннотация не указана.
Авторы: Alam, Md. Jawaherul; Goodrich, Michael T.; Johnson, Timothy
Журнал: —
Год: 2016

Navigation techniques for {2.5D} graph layout
Аннотация:
In this paper, we consider the problem of navigating graphs drawn in 2.5 dimensions. First, we define criteria for good navigation and then present various methods to satisfy some of the criteria. In particular, we design and implement methods for trees, clustered graphs and hierarchical graphs drawn in 2.5 dimensions.
Авторы: Ahmed, Adel; Hong, Seok-Hee
Журнал: —
Год: 2007
Wordle
Аннотация:
Visualization is the graphic presentation of data -- portrayals meant to reveal complex information at a glance. Think of the familiar map of the New York City subway system, or a diagram of the human brain. Successful visualizations are beautiful not only for their aesthetic design, but also for elegant layers of detail that efficiently generate insight and new understanding. This book examines the methods of two dozen visualization experts who approach their projects from a variety of perspectives -- as artists, designers, commentators, scientists, analysts, statisticians, and more. Together they demonstrate how visualization can help us make sense of the world. Contributors include: Nick Bilton, Michael E. Driscoll, Jonathan Feinberg, Danyel Fisher, Jessica Hagy, Gregor Hochmuth, Todd Holloway, Noah Iliinsky, Eddie Jabbour, Valdean Klump, Aaron Koblin, Robert Kosara, Valdis Krebs, JoAnn Kuchera-Morin et al., Andrew Odewahn, Adam Perer, Anders Persson, Maximilian Schich, Matthias Shapiro, Julie Steele, Moritz Stefaner, Jer Thorp, Fernanda Viegas, Martin Wattenberg, and Michael Young.
Авторы: Feinberg, Jonathan
Журнал: —
Год: 2010
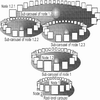
{RELT} -- Visualizing Trees on Mobile Devices
Аннотация:
The small screens on increasingly used mobile devices challenge the traditional visualization methods designed for desktops. This paper presents a method called "Radial Edgeless Tree" (RELT) for visualizing trees in a 2-dimensional space. It combines the existing connection tree drawing with the space-filling approach to achieve the efficient display of trees in a small geometrical area, such as the screen that are commonly used in mobile devices. We recursively calculate a set of non-overlapped polygonal nodes that are adjacent in the hierarchical manner. Thus, the display space is fully used for displaying nodes, while the hierarchical relationships among the nodes are presented by the adjacency (or boundary-sharing) of the nodes. It is different from the other traditional connection approaches that use a node-link diagram to present the parent-child relationships which waste the display space. The hierarchy spreads from north-west to south-east in a top-down manner which naturally follows the traditional way of human perception of hierarchies. We discuss the characteristics, advantages and limitations of this new technique and suggestions for future research.
Авторы: Hao, Jie; Zhang, Kang; Huang, Mao Lin
Журнал: —
Год: 2007
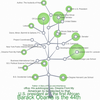
The {DeepTree} Exhibit: Visualizing the {Tree of Life} to Facilitate Informal Learning
Аннотация:
In this paper, we present the DeepTree exhibit, a multi-user, multi-touch interactive visualization of the Tree of Life. We developed DeepTree to facilitate collaborative learning of evolutionary concepts. We will describe an iterative process in which a team of computer scientists, learning scientists, biologists, and museum curators worked together throughout design, development, and evaluation. We present the importance of designing the interactions and the visualization hand-in-hand in order to facilitate active learning. The outcome of this process is a fractal-based tree layout that reduces visual complexity while being able to capture all life on earth; a custom rendering and navigation engine that prioritizes visual appeal and smooth fly-through; and a multi-user interface that encourages collaborative exploration while offering guided discovery. We present an evaluation showing that the large dataset encouraged free exploration, triggers emotional responses, and facilitates visitor engagement and informal learning.
Авторы: Block, Florian; Horn, Michael S.; Phillips, Brenda Caldwell; Diamond, Judy; Evans, E. Margaret; Shen, Chia
Журнал: IEEE Transactions on Visualization and Computer Graphics
Год: 2012
{Double Tree}: An Advanced {KWIC} Visualization for Expert Users
Аннотация:
In this paper we present Double Tree, a new visualization of Key Word In Context (KWIC) displays targeted to support linguistic analysis. Inspired by Wattenberg's and Viegas' Word Tree visualization, Double Tree extends the idea of representing KWIC results as trees. We address several issues with Word Trees with respect to the specific demands of linguists and discuss the design decisions and implementation details that we chose for Double Tree. In particular we present our approach for displaying a two-sided tree. We describe details of the layout, including how frequency and linguistic information is incorporated, and what user interaction is supported. We conclude with some consideration on possible next steps for Double Tree.
Авторы: Culy, Chris; Lyding, Verena
Журнал: —
Год: 2010
DOI: 10.1109/IV.2010.24
Dynamic Aggregation with Circular Visual Designs
Аннотация:
One very effective method for managing large data sets is aggregation or binning. We consider two aggregation methods that are tightly coupled with interactive manipulation and the visual representation of the data. Through this integration we hope to provide effective support for the aggregation process, specifically by enabling: 1) automatic aggregation, 2) continuous change and control of the aggregation level, 3) spatially based aggregates, 4) context maintenance across different aggregate levels, and 5) feedback on the level of aggregation.
Авторы: Chuah, Mei C.
Журнал: —
Год: 1998
Ordered and Unordered Treemap. Algorithms and Their Applications on Handheld Devices
Аннотация:
This thesis describes a way to visualize hierarchical structures on PDAs using Treemaps. A new ordered layout algorithm for treemaps, called Split Layout, is presented. Traditionally, treemap algorithms have exhibited a trade off between good aspect ratio and ordered layout. The new Split Layout is compared to five published treemap algorithms. Properties such as avarage aspect ratio, stability, run time and readability are measured, and it is shown that the new Split Layout performs better than any known ordered layout. The average aspect ratio is about 23\% better and the stability increased between 28\% and 40\%. A user study was performed to measure the quality of the ordering of the new algorithm. 30 users gave a total of 360 measured response times, and it was found that the median time to locate a specific rectangle in the treemap only took 0.14 seconds (5\%) longer for the Split Layout than for the Pivot by Split Size algorithm. The technique was implemented on a PDA and used for visualizing threaded discussion forums. User studies confirm that the concept on using treemaps on PDAs looks promising. The contents of the forum was easily grasped, even though the number of articles exceeded one hundred.
Авторы: Engdahl, Bj\"orn
Журнал: —
Год: 2005
{Timeline Trees}: visualizing sequences of transactions in information hierarchies
Аннотация:
In many applications transactions between the elements of an information hierarchy occur over time. For example, the product offers of a department store can be organized into product groups and subgroups to form an information hierarchy. A market basket consisting of the products bought by a customer forms a transaction. Market baskets of one or more customers can be ordered by time into a sequence of transactions. Each item in a transaction is associated with a measure, for example, the amount paid for a product. In this paper we present a novel method for visualizing sequences of these kinds of transactions in information hierarchies. It uses a tree layout to draw the hierarchy and a timeline to represent progression of transactions in the hierarchy. We have developed several interaction techniques that allow the users to explore the data. Smooth animations help them to track the transitions between views. The usefulness of the approach is illustrated by examples from several very different application domains.
Авторы: Burch, Michael; Beck, Fabian; Diehl, Stephan
Журнал: —
Год: 2008
Creating Visual Browsers for Large-Scale Online Auctions
Аннотация:
This chapter discusses the requirements raised for running online auctions as well as the technical issues on the design of graphical user interfaces and how we could use these graphical interfaces to help users navigate visualization technique called EncCon as well as the design of graphic attributes that can be used to present the domain specific attributes of the auction items and the relational structures among these items, and these graphic presentations will provide users with a clear map showing the possible paths to the target items. We will demonstrate the effectiveness of our techniques by illustrating an online auction prototype that simulates the ordinary auction activities with the assistance of visualization.
Авторы: Huang, Mao Lin; Nguyen, Quang Vinh; Lai, Wei
Журнал: —
Год: 2007
A note on optimal area algorithms for upward drawings of binary trees
Аннотация:
The goal of this paper is to investigate the area requirements for upward grid drawings of binary trees. First, we show that there is a family of binary trees with n vertices that require w(n*logn) area; this bound is tight to within a constant factor, i.e. any binary tree with n vertices can be drawn in O(n*logn) area. Then we present an algorithm for constructing an upward drawing of a complete binary tree with n vertices in O(n) area, and, finally, we extend this result to the drawings of Fibonacci trees.
Авторы: Crescenzi, Pierluigi; Battista, Giuseppe Di; Piperno, Adolfo
Журнал: Computational Geometry
Год: 1992
Structural Analysis and Visualization of {C}++ Code Evolution using Syntax Trees
Аннотация:
We present a method to detect and visualize evolution patterns in C++ source code. Our method consists of three steps. First, we extract an annotated syntax tree (AST) from each version of a given C++ source code. Next, we hash the extracted syntax nodes based on a metric combining structure and type information, and construct matches (correspondences) between similar-hash subtrees. Our technique detects code fragments which have not changed, or changed little, during the software evolution. By parameterizing the similarity metric, we can flexibly decide what is considered to be identical or not during the software evolution. Finally, we visualize the evolution of the code structure by emphasizing both changing and constant code patterns. We demonstrate our technique on a versioned code base containing a variety of changes ranging from simple to complex.
Авторы: Chevalier, Fanny; Auber, David; Telea, Alexandru
Журнал: —
Год: 2007
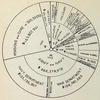
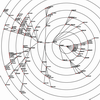
{DocuBurst}: Visualizing Document Content using Language Structure
Аннотация:
Textual data is at the forefront of information management problems today. One response has been the development of visualizations of text data. These visualizations, commonly based on simple attributes such as relative word frequency, have become increasingly popular tools. We extend this direction, presenting the first visualization of document content which combines word frequency with the human-created structure in lexical databases to create a visualization that also reflects semantic content. DocuBurst is a radial, space-filling layout of hyponymy (the IS-A relation), overlaid with occurrence counts of words in a document of interest to provide visual summaries at varying levels of granularity. Interactive document analysis is supported with geometric and semantic zoom, selectable focus on individual words, and linked access to source text.
Авторы: Collins, Christopher; Carpendale, Sheelagh; Penn, Gerald
Журнал: Computer Graphics Forum
Год: 2009

Graphic Presentation
Аннотация:
Graphic Presentation is largely a collection of interesting charts and pictures, mostly of a non-technical nature,covering a wide range of subject matter, with brief comment on methodology under each illustration. These charts and pictures are reproductions from numerous sources, including a few from his Graphic Methods. In addition to the chapters on types of charts and excerpts from Time Series Charts: A Manual of Design and Construction published by the American Society of Mechanical Engineers, there are some quasi-technical chapters on such things as the use of cameras and lantern slides, selection of paper, and methods of reproduction, printing, and binding. A chapter on tabulation is thrown in, apparently for good measure. Illustrations on alternate pairs of facing pages arc in color, and these pages contain also decorative chapter identification (bleed-outs) at the top and bottom. Printing was done by the photo offset process. The verbal language is Basic English. A minor feature of the book is a device whereby the reader may spin the pages rapidly until he reaches the desired chapter. On page 453 is given a detailed description of how the book was made up, including the names and addresses of the companies furnishing materials or services. This book departs from the earlier contribution in several respects. Text material is boiled down almost to the vanishing point, leaving the maximum number of charts to speak for themselves.
Авторы: Brinton, Willard Cope
Журнал: —
Год: 1939

Methods and devices for selecting items such as data files
Аннотация:
A method is described for allowing a user to select one of a plurality of items. The user employs a device having a display area, and a joystick or a contact sensitive area. The device displays a number of regions equal to the number of items, and defines a number of sections in the angular range of the joystick, or sections within the contact sensitive area, equal to the number of items, and arranged corresponding to the arrangement of the regions of the display area. The user selects one of said items by selecting the corresponding section.
Авторы: Clifton-Bligh, Gervase
Журнал: —
Год: 2010
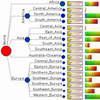
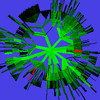
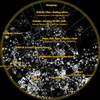
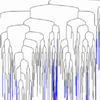
DensiTree 2: Seeing trees through the forest
Аннотация:
Phylogenetic analysis like Bayesian MCMC or bootstrapping result in a collection of trees. Trees are discrete objects and it is generally difficult to get a mental grip on a distributions over trees. Visualisation tools like DensiTree can give good intuition on tree distributions. It works by drawing all trees in the set transparently thus highlighting areas where the tree in the set agrees. In this way, both uncertainty in clade heights and uncertainty in topology can be visualised. In our experience, a vanilla DensiTree can turn out to be misleading in that it shows too much uncertainty due to wrongly ordering taxa or due to unlucky placement of internal nodes. DensiTree is extended to allow visualisation of meta-data associated with branches such as population size and evolutionary rates. Furthermore, geographic locations of taxa can be shown on a map, making it easy to visually check there is some geographic pattern in a phylogeny. Taxa orderings have a large impact on the layout of the tree set, and advances have been made in finding better orderings resulting in significantly more informative visualisations. We also explored various methods for positioning internal nodes, which can improve the quality of the image. Together, these advances make it easier to comprehend distributions over trees.
Авторы: Bouckaert, Remco R.; Heled, Joseph
Журнал: bioRxiv.org e-print service
Год: 2014
DOI: 10.1101/012401
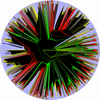
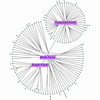
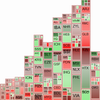
Generalized {Pythagoras Trees} for Visualizing Hierarchies
Аннотация:
Pythagoras Trees are fractals that can be used to depict binary hierarchies. But this binary encoding is an obstacle for visualizing hierarchical data such as file systems or phylogenetic trees, which branch into n subhierarchies. Although any hierarchy can be modeled as a binary one by subsequently dividing n-ary branches into a sequence of n-1 binary branches, we follow a different strategy. In our approach extending Pythagoras Trees to arbitrarily branching trees, we only need a single visual element for an n-ary branch instead of spreading the binary branches along a strand. Each vertex in the hierarchy is visualized as a rectangle sized according to a metric. We analyze several visual parameters such as length, width, order, and color of the nodes against the use of different metrics. The usefulness of our technique is illustrated by two case studies visualizing directory structures and a large phylogenetic tree. We compare our approach with existing tree diagrams and discuss questions of geometry, perception, readability, and aesthetics.
Авторы: Beck, Fabian; Burch, Michael; Munz, Tanja; Silvestro, Lorenzo Di; Weiskopf, Daniel
Журнал: —
Год: 2014
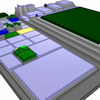
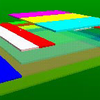
Extending Tree-Maps to Three Dimensions: A Comparative Study
Аннотация:
This paper presents StepTree, an information visualization tool designed for depicting hierarchies, such as directory structures. StepTree is similar to the hierarchy-visualization tool, Treemap, in that it uses a rectangular, space-filling methodology, but differs from Treemap in that it employs three-dimensional space, which is used to more clearly convey the structural relationships of the hierarchy. The paper includes an empirical study comparing typical search and analysis tasks using StepTree and Treemap. The study shows that users perform significantly better on tasks related to interpreting structural relationships when using StepTree. In addition, users achieved the same performance with StepTree and Treemap when doing a range of other common interpretative and navigational tasks.
Авторы: Bladh, Thomas; Carr, David A.; Scholl, Jeremiah
Журнал: —
Год: 2004
A Magic Treemap Cube for Visualizing Olympic Games Data
Аннотация:
Treemap, a common information visualization approach for dividing a display area into nested rectangles, has a good performance on visualizing hierarchical data. And it enables user to compare nodes in the same level and to learn certain relationship between adjacent levels. However, treemap layout is limited to visualize multi-dimensional hierarchical data in which the hierarchy is unfixed and complex, especially when the hierarchy is an arbitrary graph. Considering this problem, we present a novel extension called magic treemap cube, which improves the layout and has a good performance on visualizing unfixed (cross-level) and complex data, inverting hierarchy without reorganizing the structure, and enabling users to easily compare among treemaps. The magic treemap cube is a three-dimensional regular hexahedron whose six faces are covered by six different treemaps. Each dimension of the magic treemap cube is a hierarchy structure specified by users according to a hierarchical division of visualization information. With the treemap algorithm, tagcloud and mapping rules, the treemaps are automatically controlled by permutations of three dimensions of the cube. Users could observe the six correlative treemaps respectively by rotating the magic treemap cube in three dimensional Cartesian coordinate. And this magic treemap cube can be unfolded into a tiled treemap in 2D Cartesian coordinate for users-friendly comparison of each treemap. Meanwhile, a merging operation to the tiled treemap is proposed to not only compare two treemaps through the adjacency relations among faces but also provide more information. For demonstrating the above characteristics, an application (called OlympicVis) has been implemented to visualize the Beijing 2008 Olympic Games information, which involves multi-dimensional hierarchy and interconnected data. The OlympicVis can display Cube View, Schedule View, Medal View, Date Filter and Time Line.
Авторы: Chen, Xiaowu; Yang, Haolin; Ma, Yongtao; Zhou, Bin
Журнал: The International Journal of Virtual Reality
Год: 2010
Navigation Techniques for Zoomable Treemaps
Аннотация:
This paper presents a new technique called zoomable treemaps that makes it possible to navigate in very large trees. It integrates several efficient interaction techniques that enable multi-scale and structure-aware navigation.
Авторы: Blanch, Renaud; Lecolinet, \'Eric
Журнал: —
Год: 2006
Graphics and Graphic Information Processing
Аннотация:
Аннотация не указана.
Авторы: Bertin, Jacques
Журнал: —
Год: 1981
Variational Circular Treemaps for interactive visualization of hierarchical data
Аннотация:
Visualization of hierarchical data is of great importance in information visualization. We present variational circular treemaps with a novel layout algorithm by solving disk packing as a continuous optimization problem. Our variational circular treemaps achieve higher space utilization ratio compared with the traditional circular treemaps and support natural interactions as focus+context distortions and drill-down and roll-up operations for data navigation. Experimental results show the effectiveness of our method for visualization and interaction.
Авторы: Zhao, Haisen; Lu, Lin
Журнал: —
Год: 2015
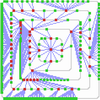
Point Placement by Phylogenetic Trees and its Application to Visual Analysis of Document Collections
Аннотация:
The task of building effective representations to visualize and explore collections with moderate to large number of documents is hard. It depends on the evaluation of some distance measure among texts and also on the representation of such relationships in bi- dimensional spaces. In this paper we introduce an alternative approach for building visual maps of documents based on their content similarity, through reconstruction of phylogenetic trees. The tree is capable of representing relationships that allows the user to quickly recover information detected by the similarity metric. For a variety of text collections of different natures we show that we can achieve improved exploration capability and more clear visualization of relationships amongst documents.
Авторы: Cuadros, Ana M.; Paulovich, Fernando V.; Minghim, Rosane; Telles, Guilherme P.
Журнал: —
Год: 2007

A Self-adaptive Treemap-based Technique for Visualizing Hierarchical Data in {3D}
Аннотация:
In this paper, we present a novel adaptive visualization technique where the constituting polygons dynamically change their geometry and other visual attributes depending on user interaction. These changes take place with the objective of conveying required level of detail to the user through each view. Our proposed technique is successfully applied to build a treemap-based but 3D visualization of hierarchical data, a widely used information structure. This new visualization exploits its adaptive nature to address issues like cluttered display, imperceptible hierarchy, lack of smooth zoom-in and out technique which are common in tree visualization. We also present an algorithm which utilizes the flexibility of our proposed technique to deal with occlusion, a problem inherent in any 3D information visualization. On one hand, our work establishes adaptive visualization as a means of displaying tree-structured data in 3D. On the other, it promotes the technique as a potential candidate for being employed to visualize other information structures also.
Авторы: Chaudhuri, Abon; Shen, Han-Wei
Журнал: —
Год: 2009
Extending the utility of treemaps with flexible hierarchy
Аннотация:
Treemaps are a visualization technique for presenting hierarchical information on two-dimensional displays. Prior implementations limit the visualization to pre-defined static hierarchies. Flexible hierarchy, a new capability of Treemap 4.0, enables users to define various hierarchies through dynamically selecting a series of data attributes so that they can discover patterns, clusters and outliers. This work describes the design and implementation issues of flexible hierarchy. It then reports on a usability study, which led to enhancements to the interface.
Авторы: Chintalapani, Gouthami; Plaisant, Catherine; Shneiderman, Ben
Журнал: —
Год: 2004
{TimeTree}: Exploring Time Changing Hierarchies
Аннотация:
Intelligence analysis often involves the task of gathering information about an organization. Knowledge about individuals in an organization and their relationships, often represented as a hierarchical organization chart, is crucial for understanding the organization. However, it is difficult for intelligence analysts to follow all individuals in an organization. Existing hierarchy visualizations have largely focused on the visualization of fixed structures and can not effectively depict the evolution of a hierarchy over time. We introduce TimeTree, a novel visualization tool designed to enable exploration of a changing hierarchy. TimeTree enables analysts to navigate the history of an organization, identify events associated with a specific entity (visualized on a TimeSlider), and explore an aggregate view of an individual's career path (a CareerTree). We demonstrate the utility of TimeTree by investigating a set of scenarios developed by an expert intelligence analyst. The scenarios are evaluated using a real dataset composed of eighteen thousand career events from more than eight thousand individuals. Insights gained from this analysis are presented.
Авторы: Card, Stuart K.; Suh, Bongwon; Pendleton, Bryan A.; Heer, Jeffrey; Bodnar, John W.
Журнал: —
Год: 2006
Trevis: A context tree visualization and analysis framework and its use for classifying performance failure reports
Аннотация:
When developers profile their applications to identify performance problems, they normally use profilers producing calling context trees. A calling context tree (CCT) represents the caller-callee relationships of a program. A dynamically collected CCT provides method coverage information. The CCTs produced by profilers also include method hotness information. Trevis, our context tree visualization and analysis framework, allows users to visualize, compare, cluster, and intersect CCTs produced by profilers. We evaluate Trevis in the context of a novel profiling tool called FlyBy. FlyBy runs transparently on an end-user's computer and continuously samples the applications' call stack. When the user perceives the application as sluggish, she presses a "Was Slow!" button to tell FlyBy to file a performance failure report. The report contains the CCT based on the call stack samples FlyBy gathered over the last few seconds before the user pressed the button. We show how Trevis allows us to visualize and classify FlyBy bug reports.
Авторы: Adamoli, Andrea; Hauswirth, Matthias
Журнал: —
Год: 2010